
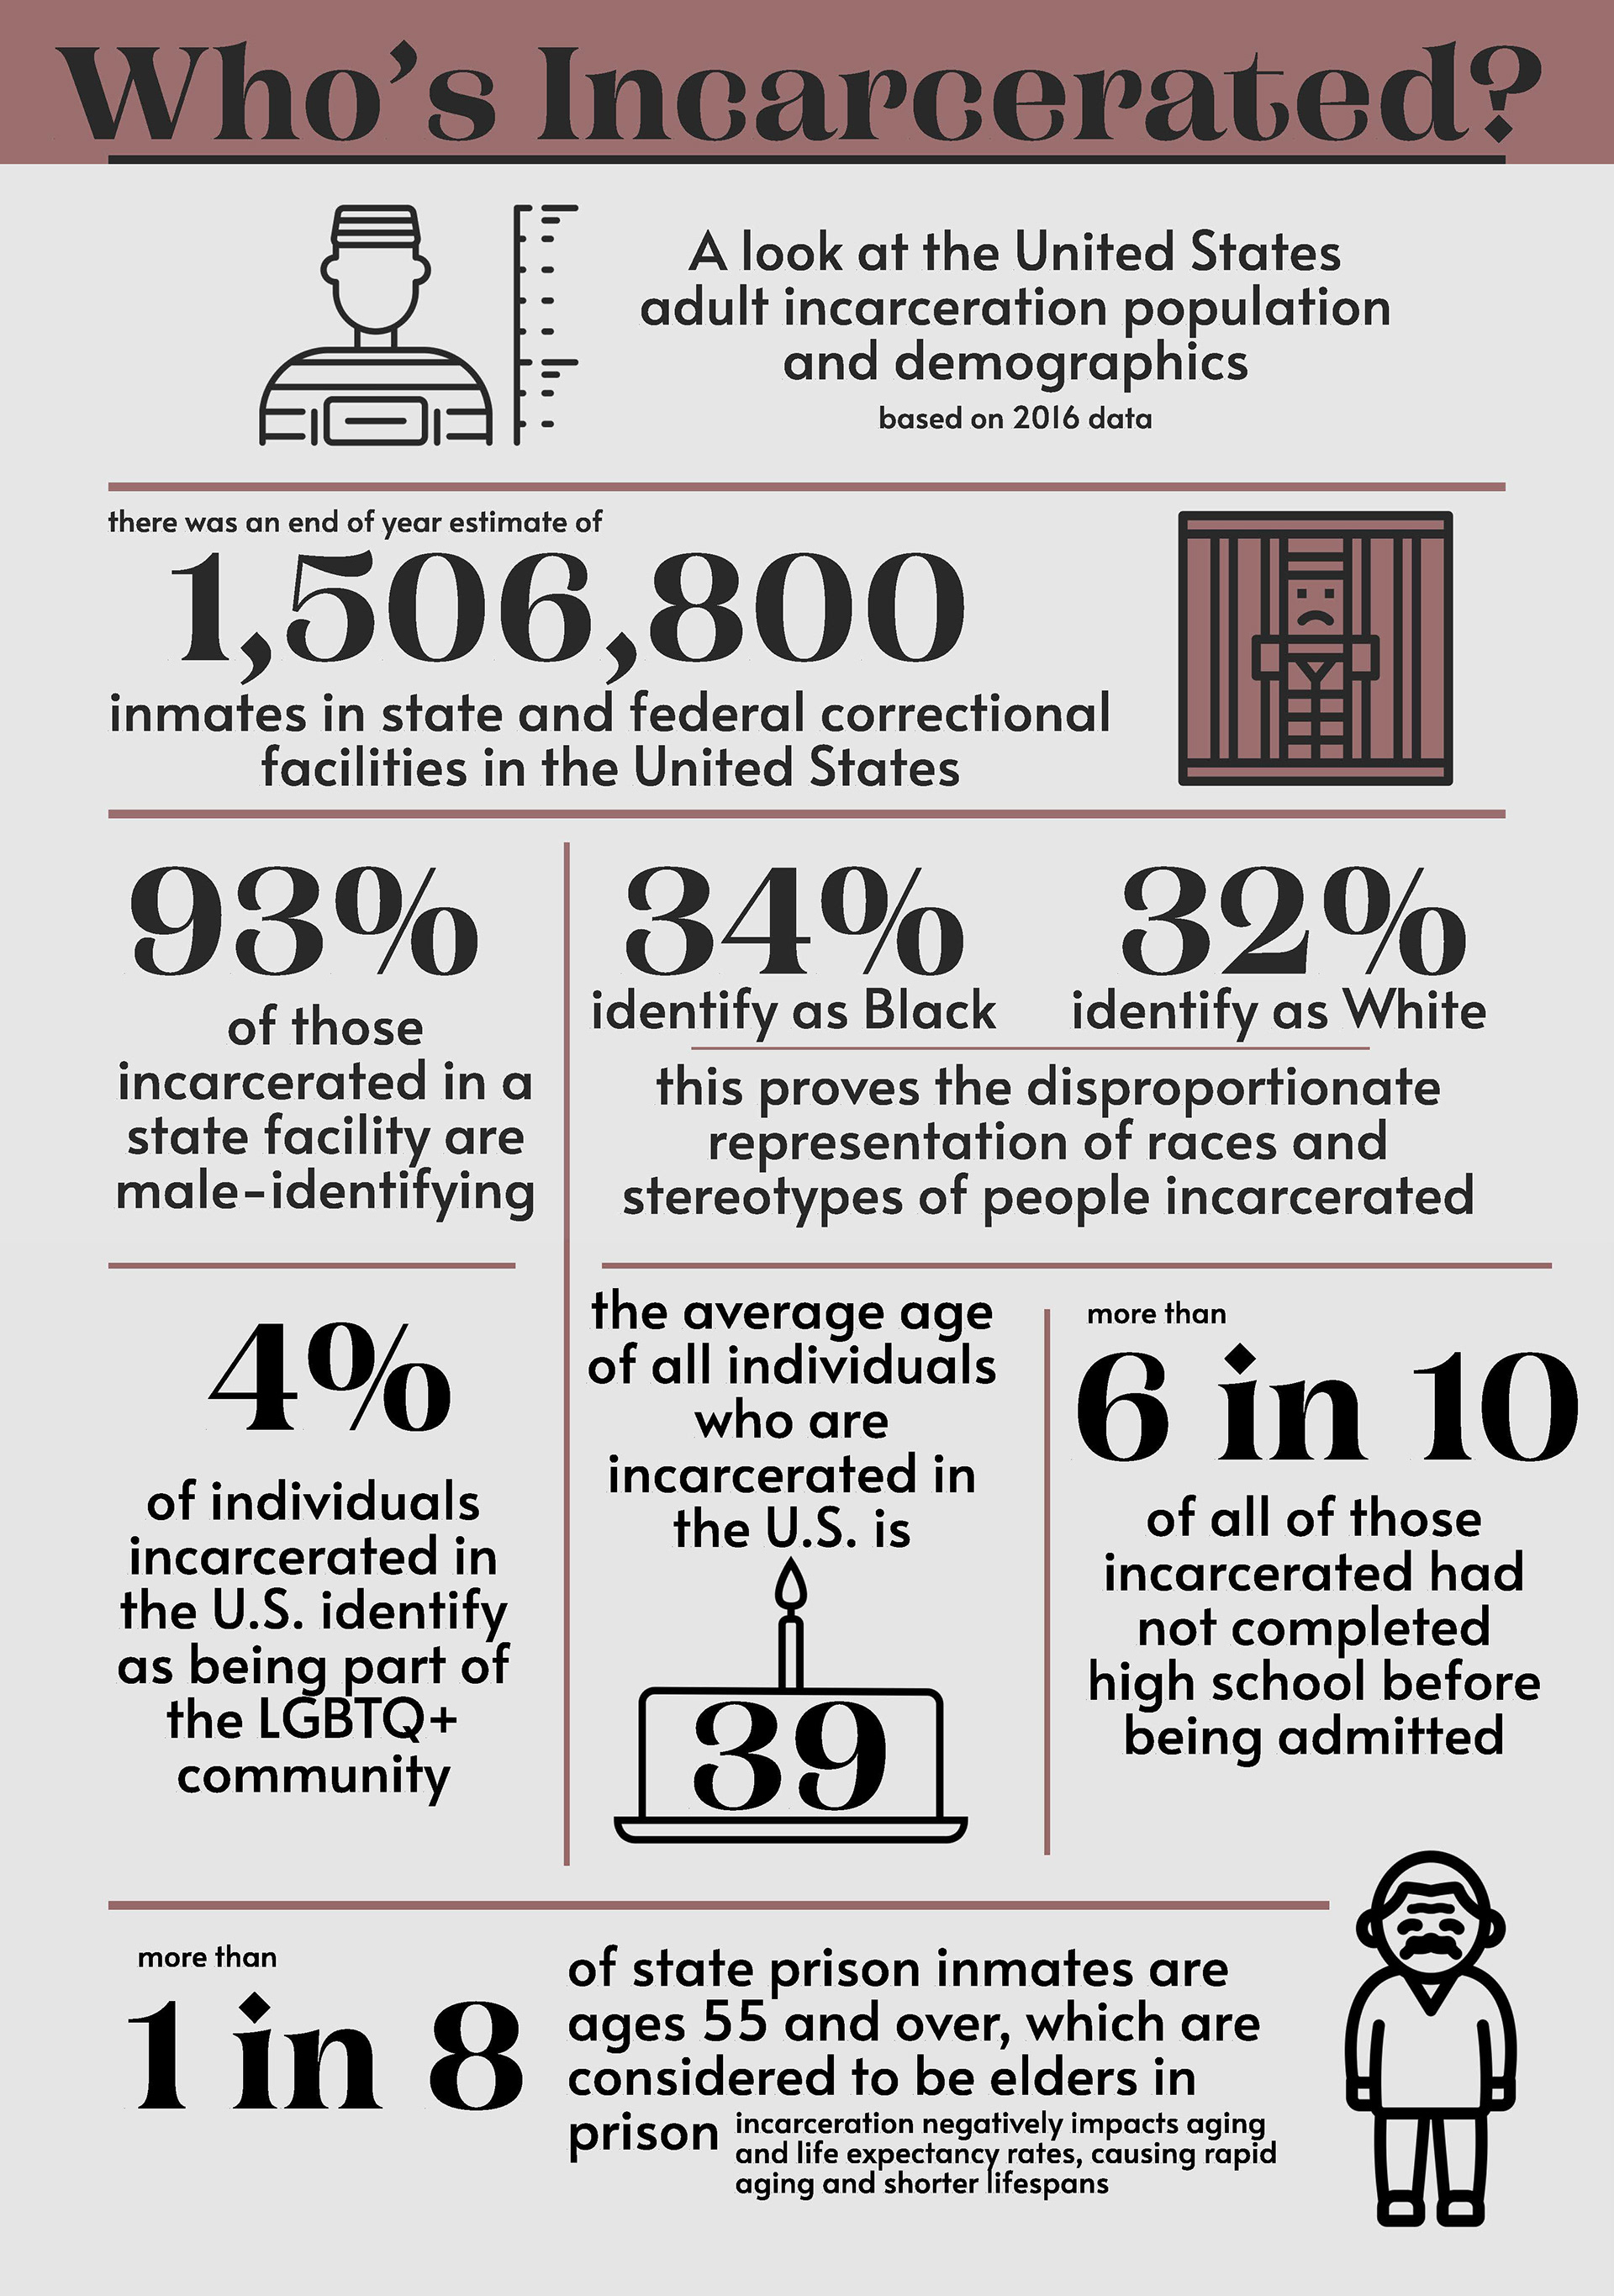
Infographic created as a criminal justice class final project. The gray background and muted red keep the layout formal and informative. The text is separated by lines to help section each statistic out. The use of on-theme icons (provided by The Noun Project) helps break up the text and gives an additional visual aspect.
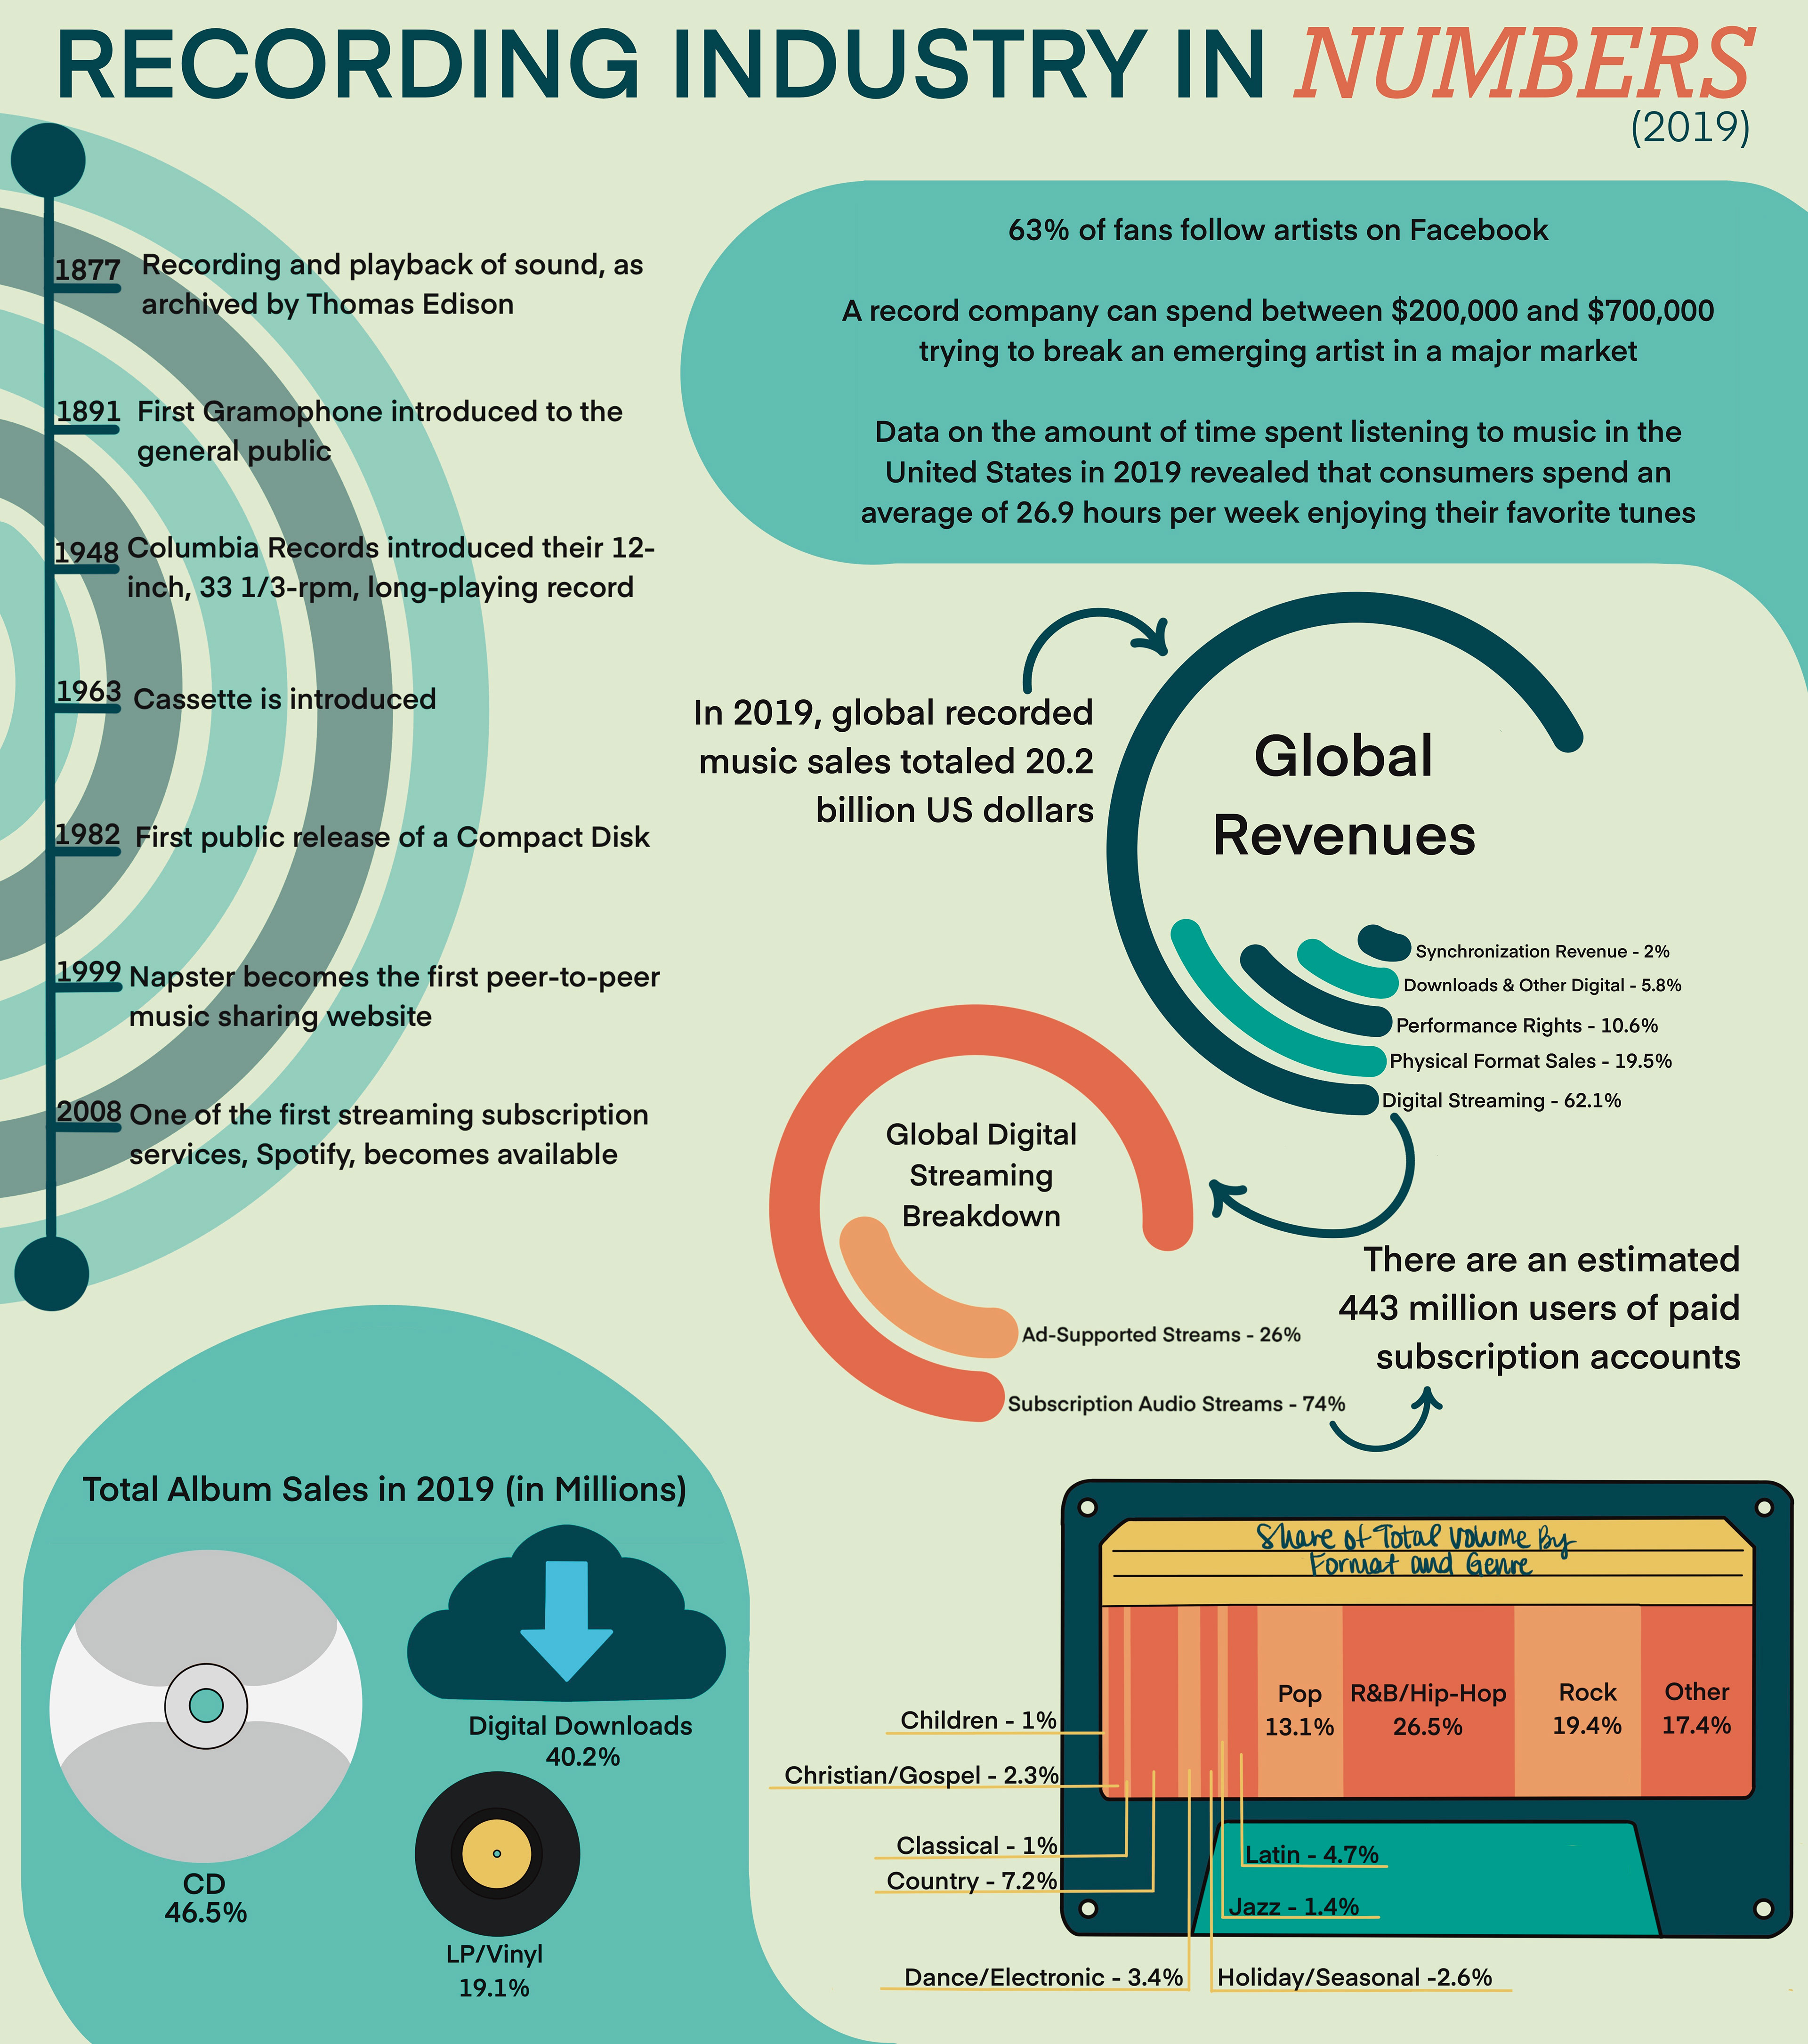
Infographic created for class: Recording Industry in Numbers. The professor gave a list of information and I created an infographic. I created icons, charts, etc. based on what I would feel appropriate and fit the theme of the infographic.
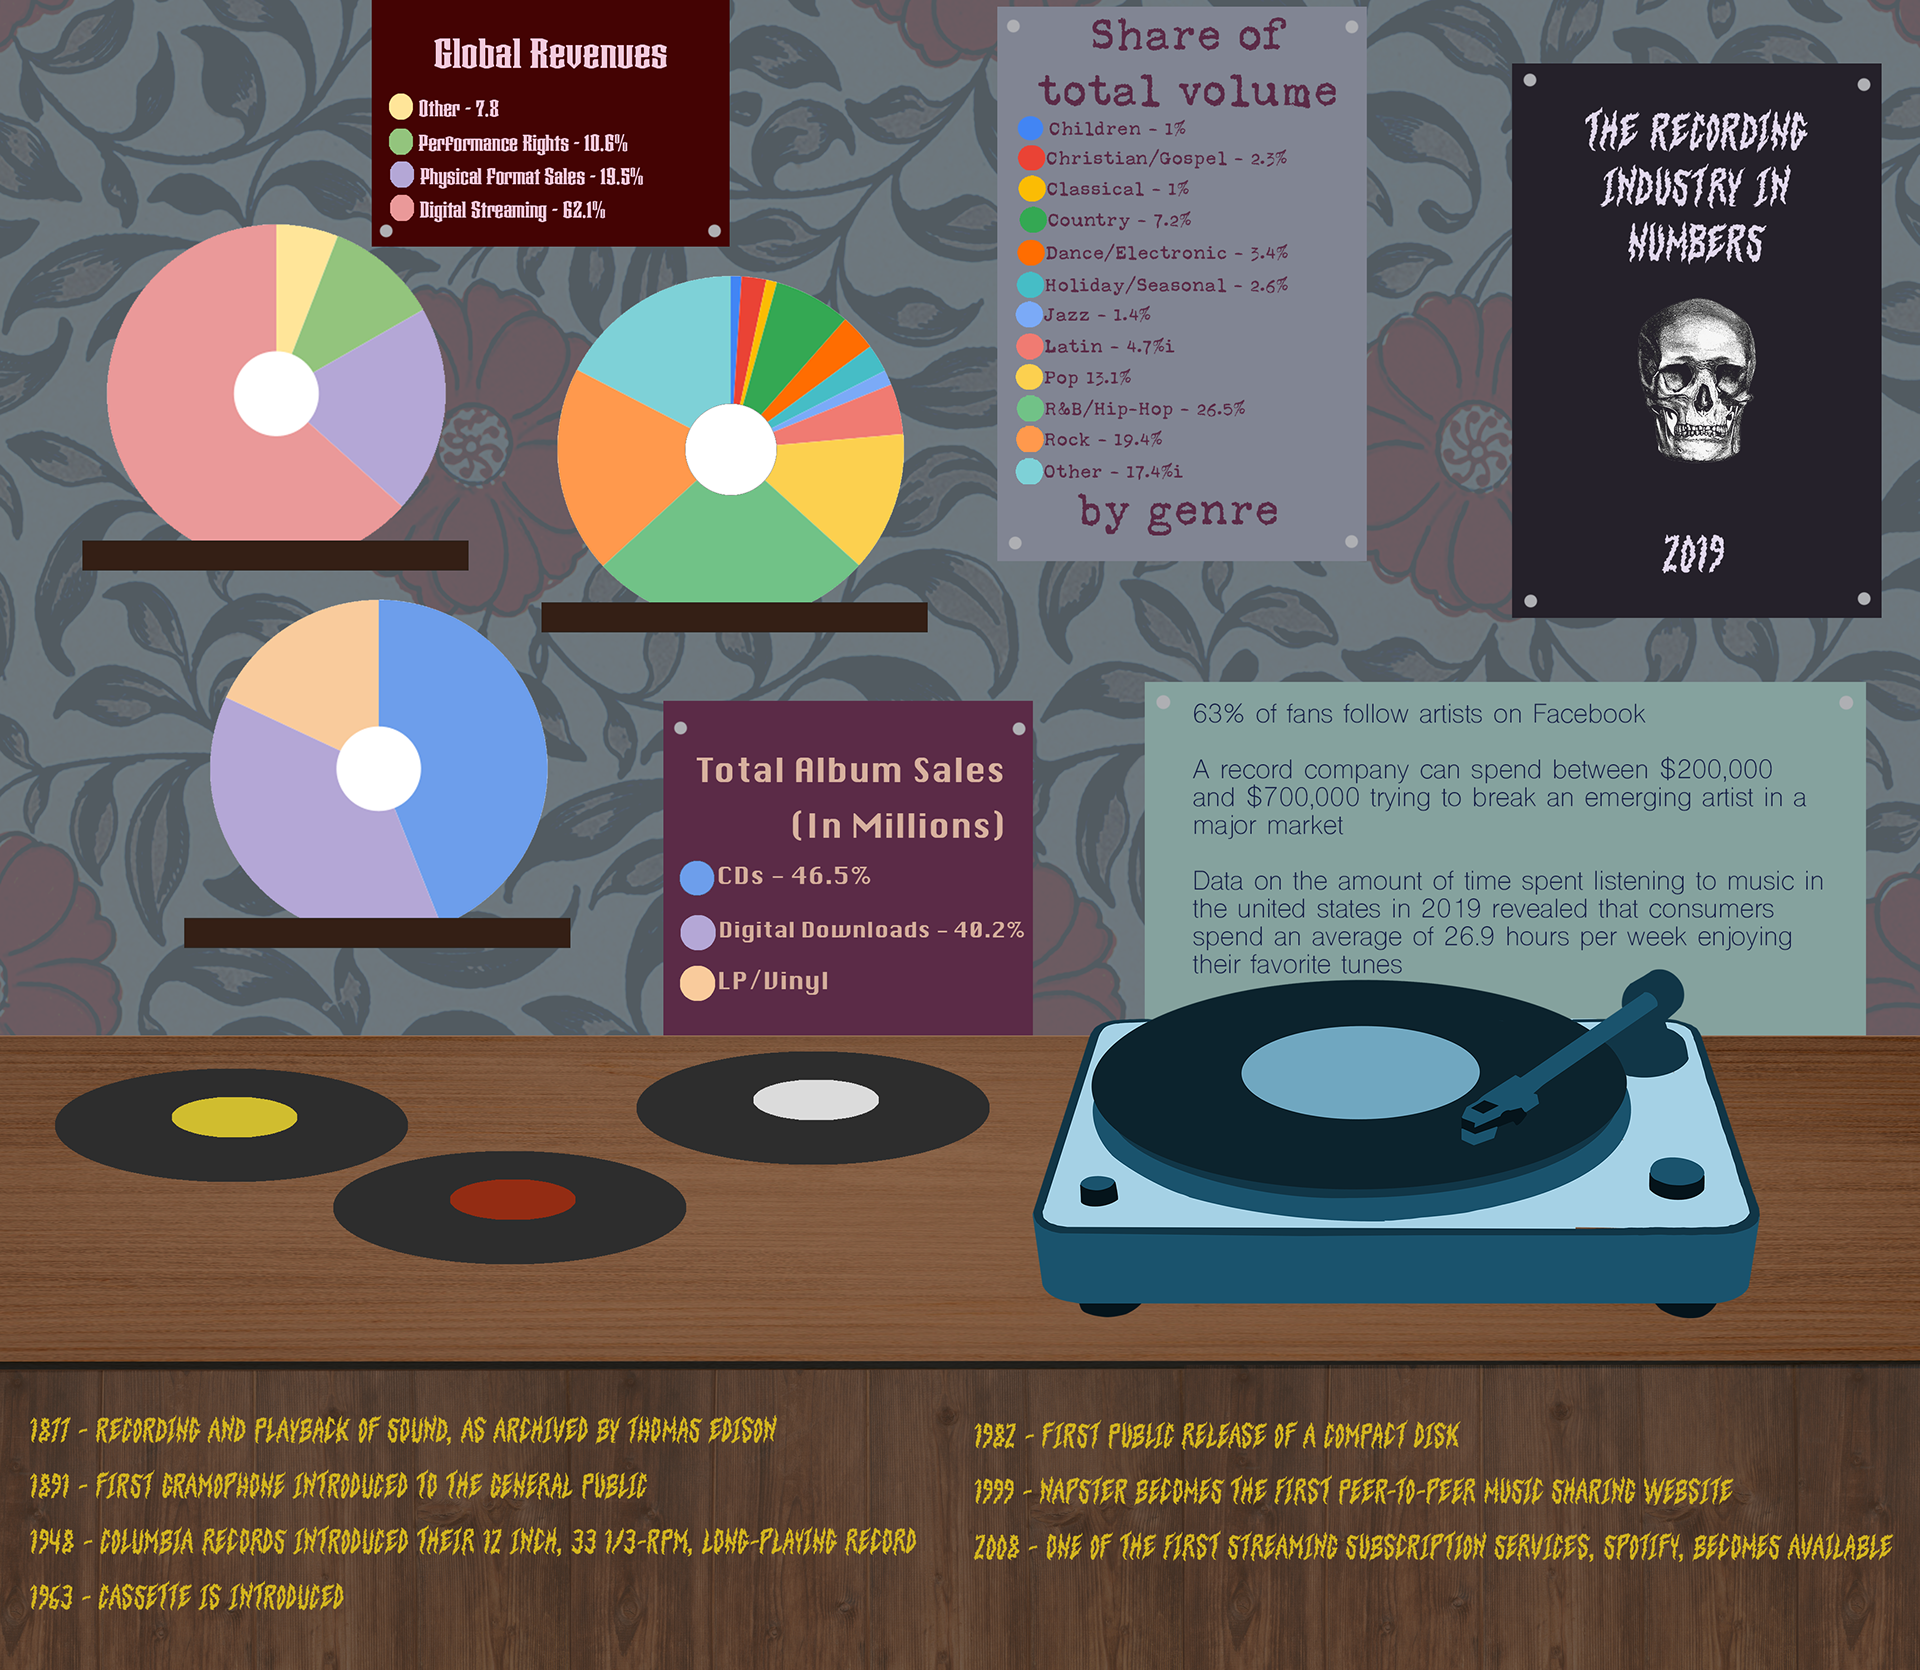
Revision of the Recording Industry in Numbers infographic for my Senior Portfolio Development class. For this course, we were instructed to select a handful of previous assignments and recreate them. For this, I took the information from the infographic above this one and created a new piece that focused more on the physical aspects of music, such as vinyl records and posters. The vinyl displayed on the wall double as pie charts, and the posters near them being their keys. Other posters display additional information, and the side of the table has a year-by-year breakdown of the industry. The record player and additional vinyl on the table create additional visual aspects that break up the information.